


The new Inventory Movement Report in Qoyod’s Reports menu lists every document that changed a product’s stock.
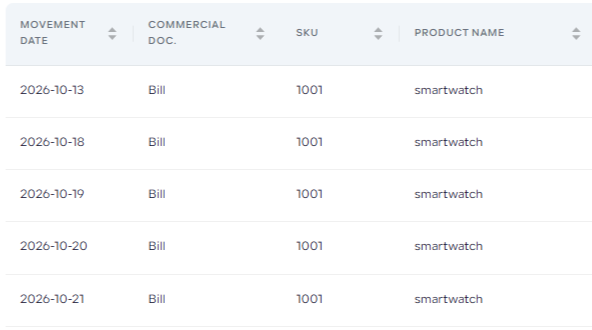
Choose a location and period, and each line shows the on-hand quantity and its value after that movement. Read it top to bottom and you see, document by document, how the product reached its current balance.
Where to find it
Go to Reports, then Inventory Movement Report. Set the date range, choose a category or a product, choose the location (a warehouse or branch), then click Filter. Reset clears the filters.
 View full size
What each line shows
- Movement Date and Commercial Doc.: when stock changed and which document changed it, such as a sales invoice, bill, debit note, credit note, transfer, stock take or reclassification.
- SKU and Product Name: the product that moved.
- Location To and Location From: the other location involved, for transfers only.
- Quantity: positive for stock in, negative for stock out.
- Average Cost: the product’s average cost at the time of the movement.
- On Hand Quantity: the running balance after the movement.
- Inventory Valuation: on-hand quantity multiplied by average cost after the movement.
The Export button below the table exports the report.
What you can use it for
- See which documents raised or lowered a product’s stock, and when.
- Match the quantities in Qoyod against a physical count and look into stock take differences.
- Follow quantities moved between locations and the direction they moved.
- See how new purchases change the average cost and the value of stock on hand.
What stays the same
The movements list on the product page and the inventory movements section on the location page work as before.
Who this update is for
Businesses that hold stock in a warehouse or branch and need to know where every change in a product’s balance came from. The report covers stocked products, which are available on the Pro and Advanced plans.
Read next