

Open the Dashboard in Web POS to see your sales for a period you choose against the previous period, find your best and least selling products, and read gross profit with a statement of how much of your sales it covers. This guide walks through each step with screenshots.
Path in Qoyod
Point of Sale › Dashboard
Steps
- Sign in to Web POS with a user who has the View dashboard permission, then open the Dashboard from the side menu. A user without this permission has no way into the dashboard.
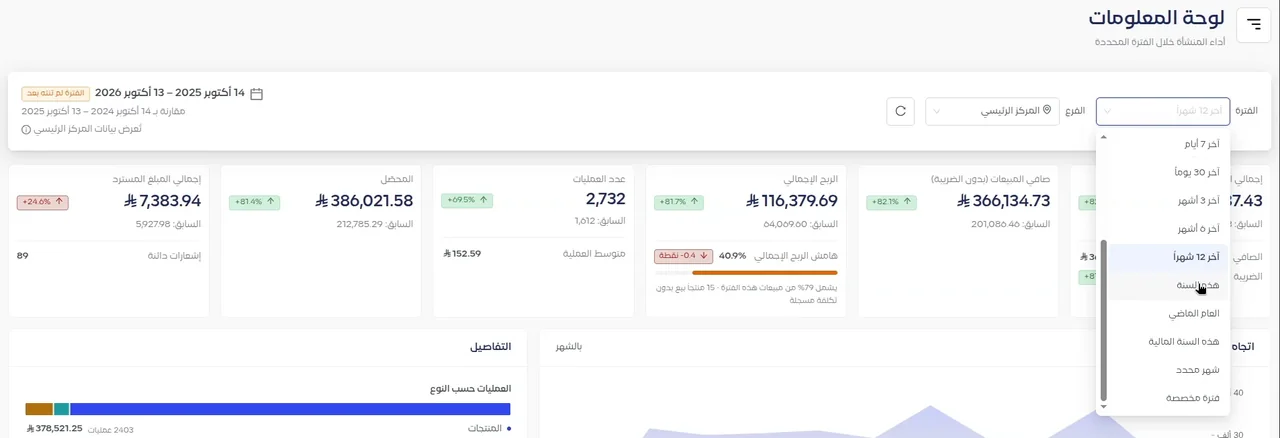
- In Period, pick a preset such as Today, Yesterday, This month, Last 30 days or Last 12 months. For any other period, pick Specific month, or Custom range, set From and To, and select Apply. The longest period is 12 months. The dashboard refuses future dates and a start date after the end date, and periods follow your organization’s time zone.
 View full size
The Period menu, with Specific month and Custom range at the bottom. - Check the dates shown beside Period so you know what you are reading. The selected dates always stay visible, and a period still running is marked “Period still in progress”.
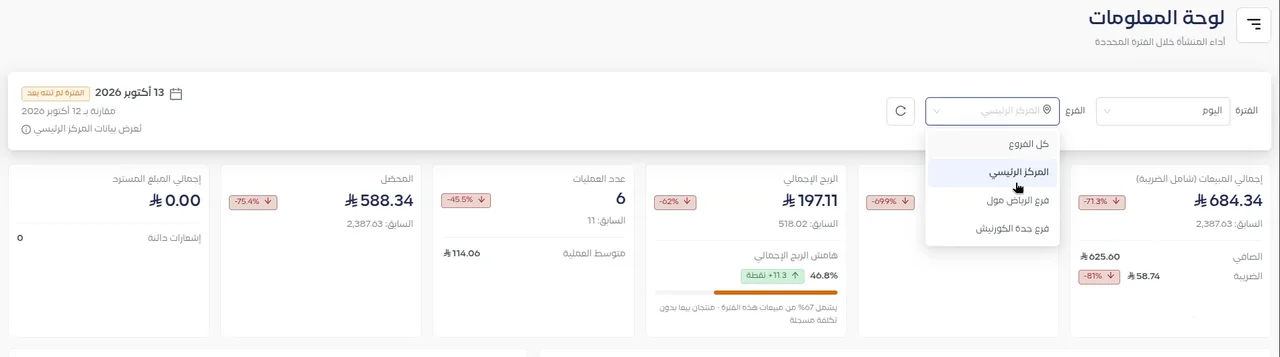
- In Location, choose one branch or All locations. All locations combines only the branches the user can access, not every branch in the organization, and every view states its scope under the dates (“Showing”). Changing the branch here changes what you see on the dashboard only. Your selling branch stays the same.
 View full size
The Location menu: All locations first, then the branches you can access.
How do I compare with the previous period?
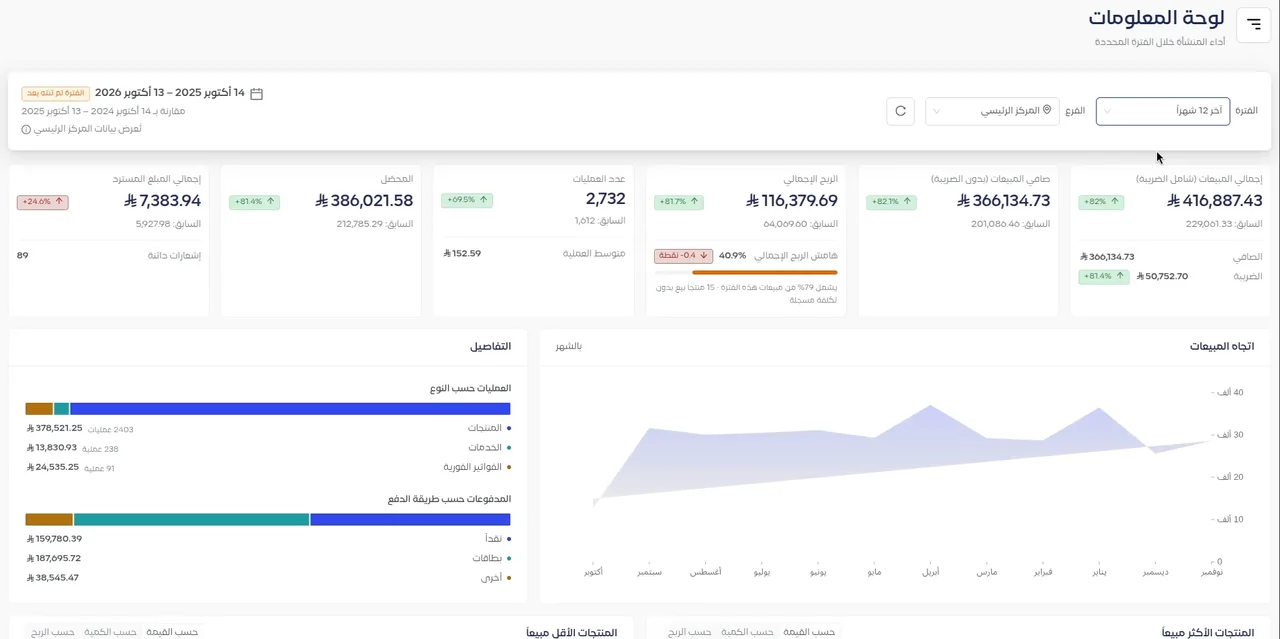
- Read the headline figures at the top of the dashboard, including total sales with VAT and net sales without VAT.
- Look under each figure: it shows how much it changed, then “Previous:” followed by the previous period’s value, with an arrow for direction as well as color. For refunds a decrease counts as an improvement, so its color is reversed.
 View full size
The dashboard on Last 12 months: each figure against the previous period, and the sales trend by month. - The previous period is of the same kind: last month if you picked a month, an equal stretch before yours if you picked a custom range, and months of different lengths are compared as they are. When yours is the first period with activity, “New this period” replaces the percentage.
- To hide the comparison, use Show comparison.
- Read the sales trend. It plots net sales by hour for a single day, by day for up to 62 days, and by month beyond that. Hover over any point to see its net value and its value with VAT. Quiet hours and days show as zero.
How do I find my best and least selling products?
- On the dashboard, go to Best selling products and Least selling products. Each card shows five products.
- Switch each card between value and quantity to change what it ranks by.
- On the least selling card, choose Include products with no sales to see what did not move at all in the period. Use the two lists to decide what to reorder and what to clear.
How do I open the product sales summary?
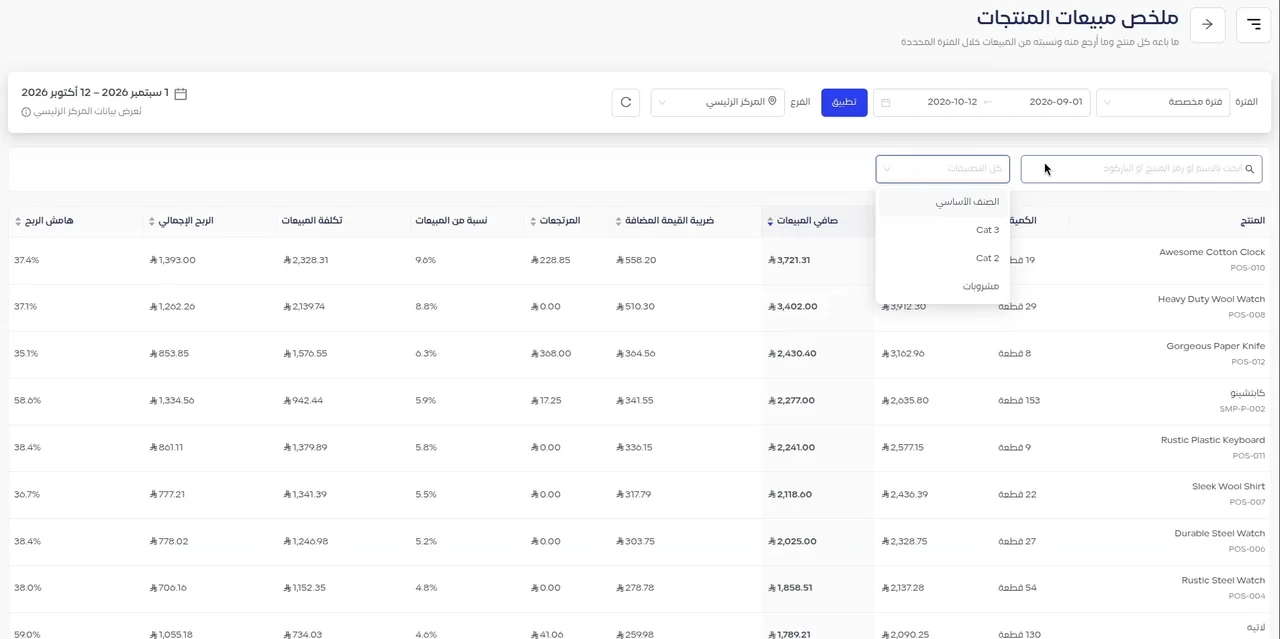
- Select View all products to open the Product sales summary. For each product it shows the quantity, gross and net sales, VAT, returns and Share of sales. Cost of sales, gross profit and margin appear there for users who hold the View profit figures permission.
- Search by name, SKU or barcode, filter by category from the category list, and sort by any column.
View full sizeThe Product sales summary with the category list open. - Read the Total for current filter row. It adds up what the table shows after the filter.
How do I see the performance of one product?
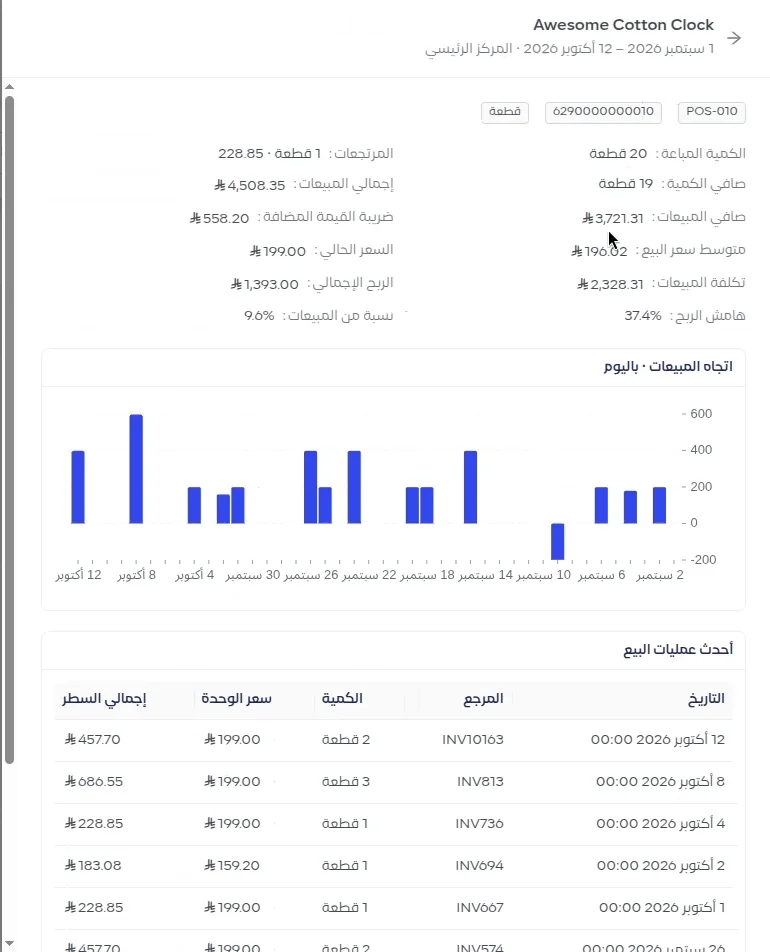
- Select a product in the Product sales summary to open a side panel showing the product’s performance.
- Read the quantity sold, net sales and returns, the Average selling price against the Current price, the product’s own sales trend, and Recent sales. Cost of sales, gross profit and margin appear there for users who hold the View profit figures permission.
 View full size
One product’s performance, in a side panel.
How do I read gross profit?
- Read Gross profit and Gross margin, with the comparison. They appear for users who hold the View profit figures permission.
- Look under the figure for the coverage statement. Profit is calculated only on products that have a recorded cost. When it covers part of the sales, the dashboard states the share (“Covers 67% of sales in this period”) and explains why in “Why profit is partial”. When no cost is recorded at all, it shows “Profit not available” instead of zero.
- For each product you see Cost of sales, gross profit and margin, and you can rank products by profit. The dashboard flags products marked “No cost recorded” or “Sold below cost”.
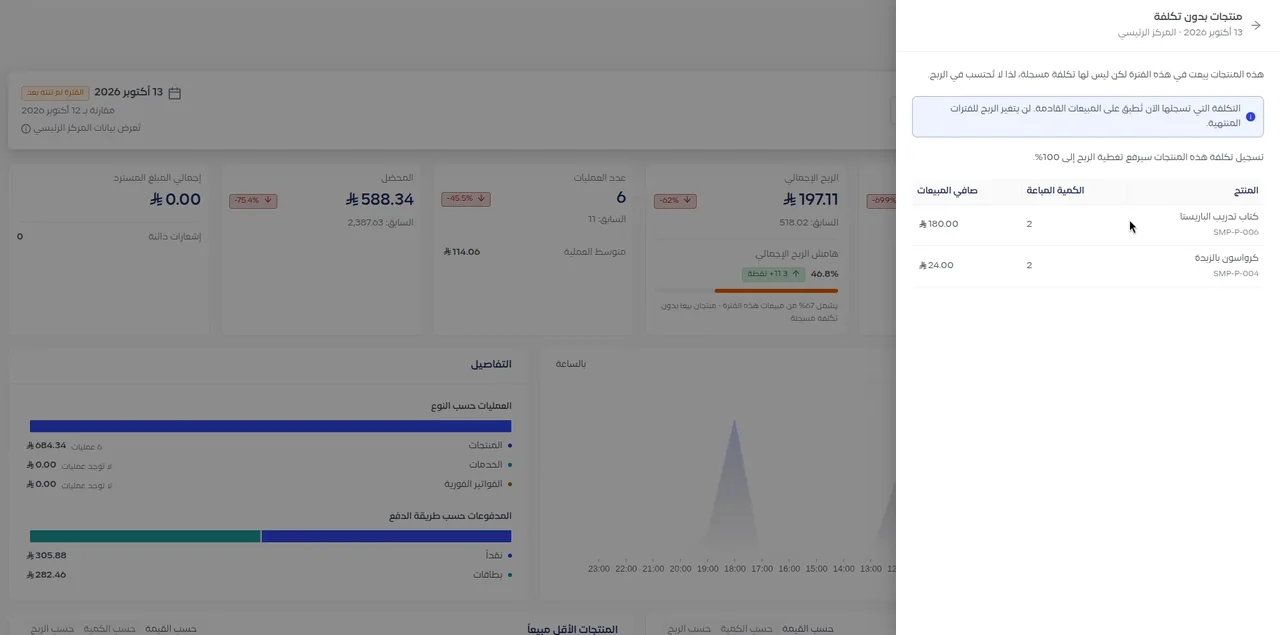
- Select the coverage statement under Gross profit to open “Why profit is partial”, then choose Products without cost. The list opens in a side panel, starts with the products that sell the most, and states the coverage profit would reach once their costs are recorded.
 View full size
The Products without cost list beside the Gross profit card. - Open a product from the list to record its cost, if your subscription allows it. A cost you record today applies to future sales only, and the profit of past periods does not change.
Who can see the dashboard?
The owner decides who sees what through POS roles, with two permissions:
- View dashboard: opens the dashboard.
- View profit figures: adds cost, gross profit and margin. It does not work without View dashboard.
To set them, open Settings, then User Management, then Manage Roles, and edit the role you need. Hidden sections are removed from the screen rather than shown greyed out, and a permission change takes effect the next time the dashboard is opened.
Notes
- Only approved documents count. Drafts and canceled documents are left out.
- Refunds count in the period the credit note was issued, not the period of the original sale.
- Profit here is gross profit, calculated only on products with a recorded cost.
- The dashboard has no export, print or share, and no side-by-side branch comparison.
- The dashboard with these capabilities is available on Web POS. The screenshots here are from Web POS and show the Arabic interface.
- For what is new, read the release note. For roles, see POS User Management from Inside Settings. For an overview of the system, see Qoyod Point of Sale.
FAQ
Why do I not see Gross profit on the dashboard?
Profit appears for users who hold View profit figures in addition to View dashboard. If no cost is recorded for the products sold, the dashboard shows “Profit not available” instead of zero.
What does “Covers 67% of sales in this period” mean under the profit?
It means profit was calculated only on products that have a recorded cost, and those products make up that share of the period’s sales. You find the products sold without a cost in the Products without cost list.
If I record a product’s cost today, does the profit of past months change?
No. A cost you record today applies to future sales only, and the profit of past periods does not change.
Does All locations mean every branch in the organization?
No. All locations combines only the branches the user can access. Changing the branch on the dashboard does not change your selling branch.
Can I export or print the dashboard figures?
No. The dashboard has no export, print or share.