




One transaction in every four
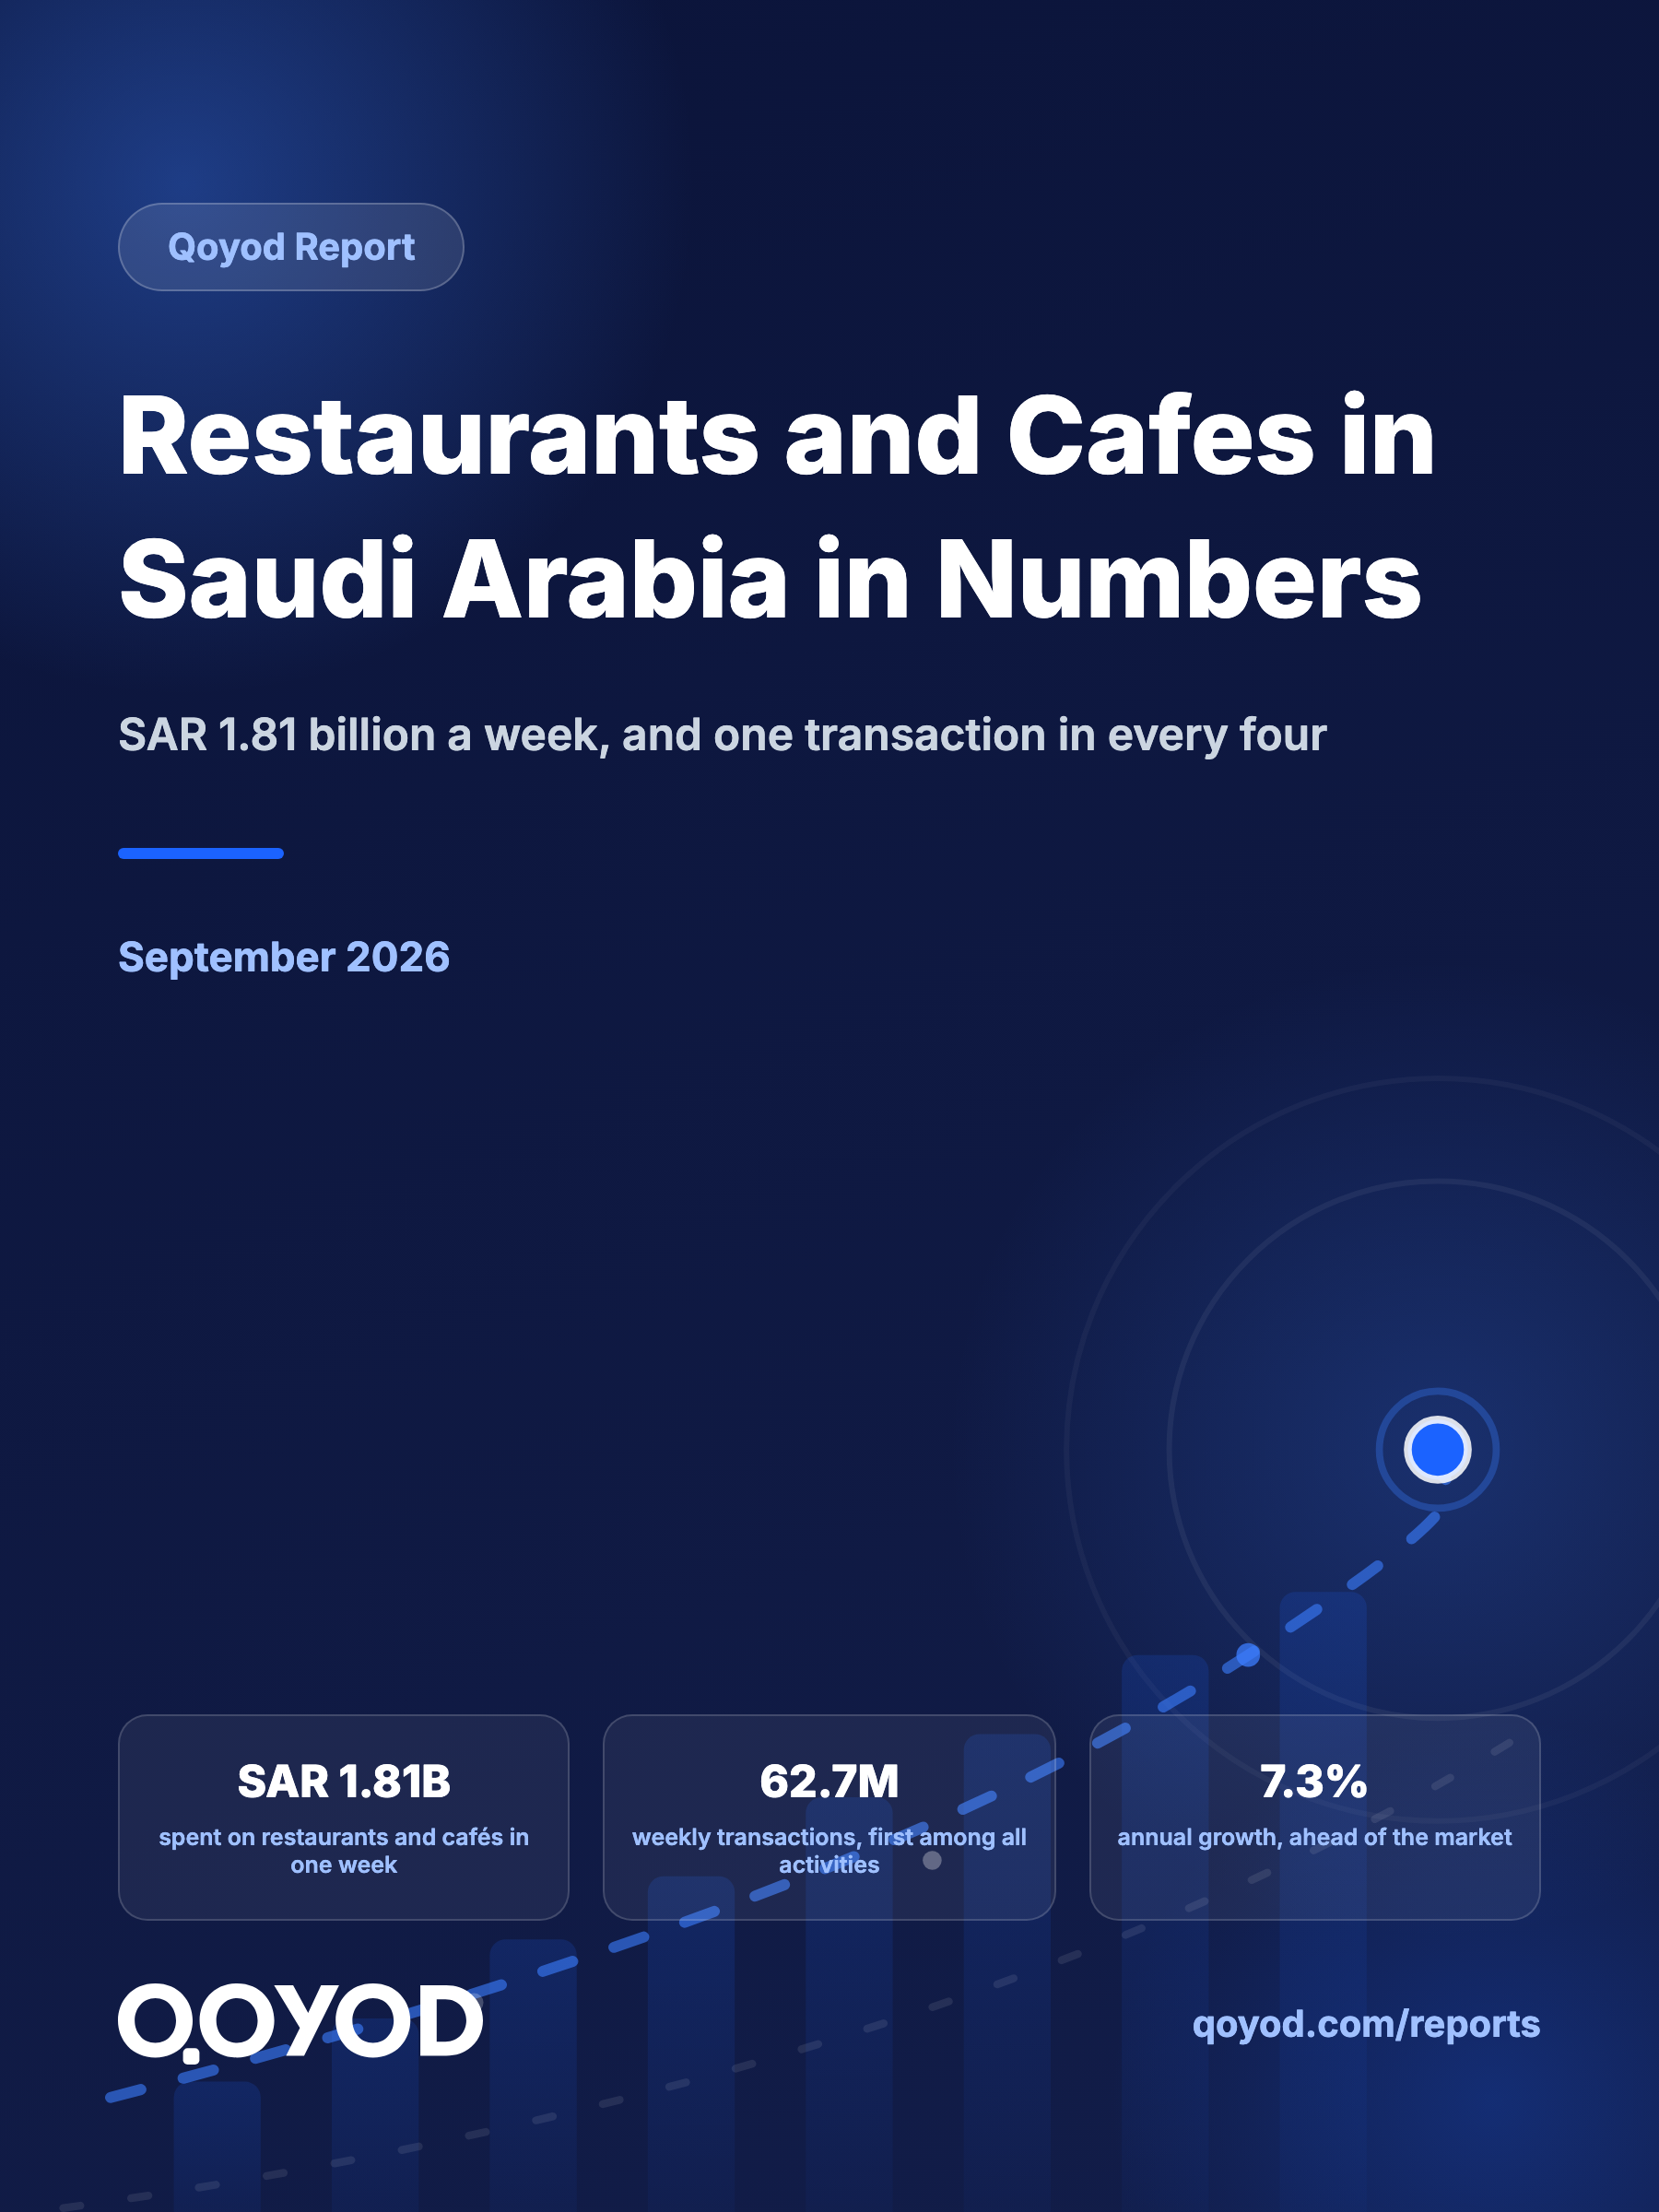
Start with the number that surprises most. In the week of 30 August to 5 September 2026, the Kingdom recorded 267.8 million point-of-sale transactions. Restaurants and cafés accounted for 62.7 million of them, or 23.4% of all activity.
That figure puts the sector ahead of every other commercial activity in the Kingdom by transaction count, above food and beverages at 62.3 million, and more than three times ahead of gas stations.
Source: Saudi Central Bank, Weekly Points of Sale Transactions, week of 30 August to 5 September 2026.
Outgrowing the market: seven weeks out of seven
Size alone does not make a story, growth does. We matched every available 2026 week against the same calendar week in 2025, and the result was striking: the sector grew in every single week, and outpaced the market in every single week too.
Restaurants and cafés averaged +7.3% growth against +4.5% for total point-of-sale spending. The sector is taking share of Saudi spending year after year, not simply riding the wave.
| Week (2025 vs 2026) | Restaurants & cafés | Total market |
|---|---|---|
| 20 Jul vs 19 Jul | +6.2% | +3.3% |
| 27 Jul vs 26 Jul | +7.5% | +4.5% |
| 3 Aug vs 2 Aug | +8.4% | +6.7% |
| 10 Aug vs 9 Aug | +7.9% | +5.3% |
| 17 Aug vs 16 Aug | +7.8% | +5.7% |
| 24 Aug vs 23 Aug | +4.6% | steady |
| 31 Aug vs 30 Aug | +8.4% | +6.0% |
| Average | +7.3% | +4.5% |
Source: Qoyod calculation from the Saudi Central Bank’s weekly point-of-sale bulletins, each 2026 week compared with its matching 2025 week.
Transaction counts tell the same story, rising between +5.0% and +7.7% across the seven weeks. The growth is real visits, not price movement alone.
SAR 28.9: the economics of the small bill
Divide value by transactions and you get the average bill: SAR 28.9. It is the lowest among the Kingdom’s major activities, and it holds the key to understanding the whole sector.
A restaurant or café does not earn from the large bill, it earns from repeating the small one. An apparel store sells a bill averaging SAR 114.4; a café sells four bills to reach the same amount. Which means one percentage point of margin, or one extra second at the till, multiplies thousands of times a month.
Source: Qoyod calculation (transaction value ÷ transaction count) from the Saudi Central Bank’s weekly point-of-sale bulletin, week of 30 August to 5 September 2026.
Two weeks above SAR 2 billion
Across twelve weeks of 2026 that we tracked, weekly spending on restaurants and cafés averaged SAR 1.77 billion and cleared the SAR 2 billion mark twice: SAR 2.02 billion in the week of 28 June to 4 July, and SAR 2.04 billion in the week of 26 July to 1 August, the highest in the tracked period.
Both peaks share one explanation: each falls in the last week of the Gregorian month, salary week. That is an operational fact a business can act on directly, because demand in this sector has a monthly rhythm that inventory, staffing and offers can be planned around.
Source: Saudi Central Bank, weekly point-of-sale bulletins for 2026. The weeks shown are the highest within twelve tracked weeks.
Extending that weekly average across a full year puts point-of-sale spending on restaurants and cafés near SAR 92 billion annually. That last figure is a Qoyod estimate built on the average of the tracked weeks rather than a published official number, but it conveys the scale of a market that tens of thousands of Saudi businesses operate in.
What these numbers mean for a restaurant or café operator
The number to keep in front of you is not 92 billion, nor 62.7 million transactions. It is SAR 28.9, because every operational decision in this sector is measured against that small, repeating bill.
First, know your cost per item, not per month. When the average bill is SAR 29, one riyal of difference in the cost of a cup of coffee decides the profitability of the whole café. The product cost and profit margin report in Qoyod shows average cost and margin per item, category and location, calculated from actual purchase invoices using the average cost method.
Second, tie components to the finished product. The composite products feature lets you define an item by its components, so components are deducted from stock when the sale is recorded in Qoyod through a manufacturing order. It is available on the Advance plan, so factor that in when choosing a plan.
Third, set discount permissions at the till. In a sector whose bill is SAR 29, an uncosted discount eats the margin quickly. The point-of-sale system lets you define who may grant a discount and their maximum percentage. Note that the point-of-sale system is a paid add-on, separate from the accounting plans and not included in the free trial.
Fourth, plan around the monthly rhythm. Both weeks that cleared SAR 2 billion fell in salary week. Let inventory and staffing follow that rhythm rather than be surprised by it, and measure the result using period comparison, which extends to 13 consecutive periods in Qoyod’s reports.
Fifth, have invoicing ready before the rush. Sixty million bills a week across the market means issuing speed and compliance are not luxuries. E-invoicing in Qoyod complies with Zakat, Tax and Customs Authority requirements for Phase 1 and Phase 2.
Prepared by Qoyod based on documented system capabilities and the sector figures in this report.
For restaurants specifically, Q.Flavours is a restaurant point-of-sale product from the same company: dine-in, takeaway and delivery order management, a kitchen screen, and table, menu and branch management. With Qoyod running the accounting layer, that is two products from the same family.
Recommendations
Five practical steps to take from the numbers in this report:
- Measure yourself against the sector, not against instinct. It grew +7.3% year on year, so a restaurant growing more slowly is looking at an opportunity, not a crisis.
- Track bill counts as closely as revenue. Transactions rose between +5.0% and +7.7%, meaning more visits rather than higher prices alone, and that is the real signal of location and offer strength.
- Calculate margin item by item. In a small-bill economy, low-margin items hide behind a healthy-looking sales total.
- Plan ahead for salary week. It is the recurring monthly peak, and inventory readiness in that week shapes the whole month.
- Revisit pricing quarterly. When a component’s cost rises by one riyal, the market pays it 62 million times, and your business pays it hundreds of times a day.
62.7 million transactions in a week, first place among every activity, and growth that beat the market seven times out of seven: restaurants and cafés are today one of the most active sectors of the Saudi economy and the closest to people’s daily lives. The business that reads its numbers with the precision of a single bill is the one that will take its share of that growth.
Sources
- Saudi Central Bank: Weekly Points of Sale Transactions, report for the week ending 5 September 2026 (primary source for the latest week: value, transaction count, activity ranking and average bill).
- Saudi Central Bank: Weekly Points of Sale Transactions for 2026, reports for the weeks ending 4 July, 8 August and 5 September (weekly spending series and peaks).
- Saudi Central Bank: Weekly Points of Sale Transactions for 2025, reports for the weeks ending 16 August, 6 September and 13 September (basis for the year-on-year comparison).
- Zakat, Tax and Customs Authority: e-invoicing requirements for Phase 1 and Phase 2.